GitMe Features
GitMe empowers engineering teams and leaders with AI-driven analytics, intelligent organization, and actionable insights—presented in a clear, interactive dashboard. By calculating Real Effort Value through AI, GitMe goes beyond commit counts to reveal the true impact of each contribution.
🔍 Comprehensive Performance Analytics
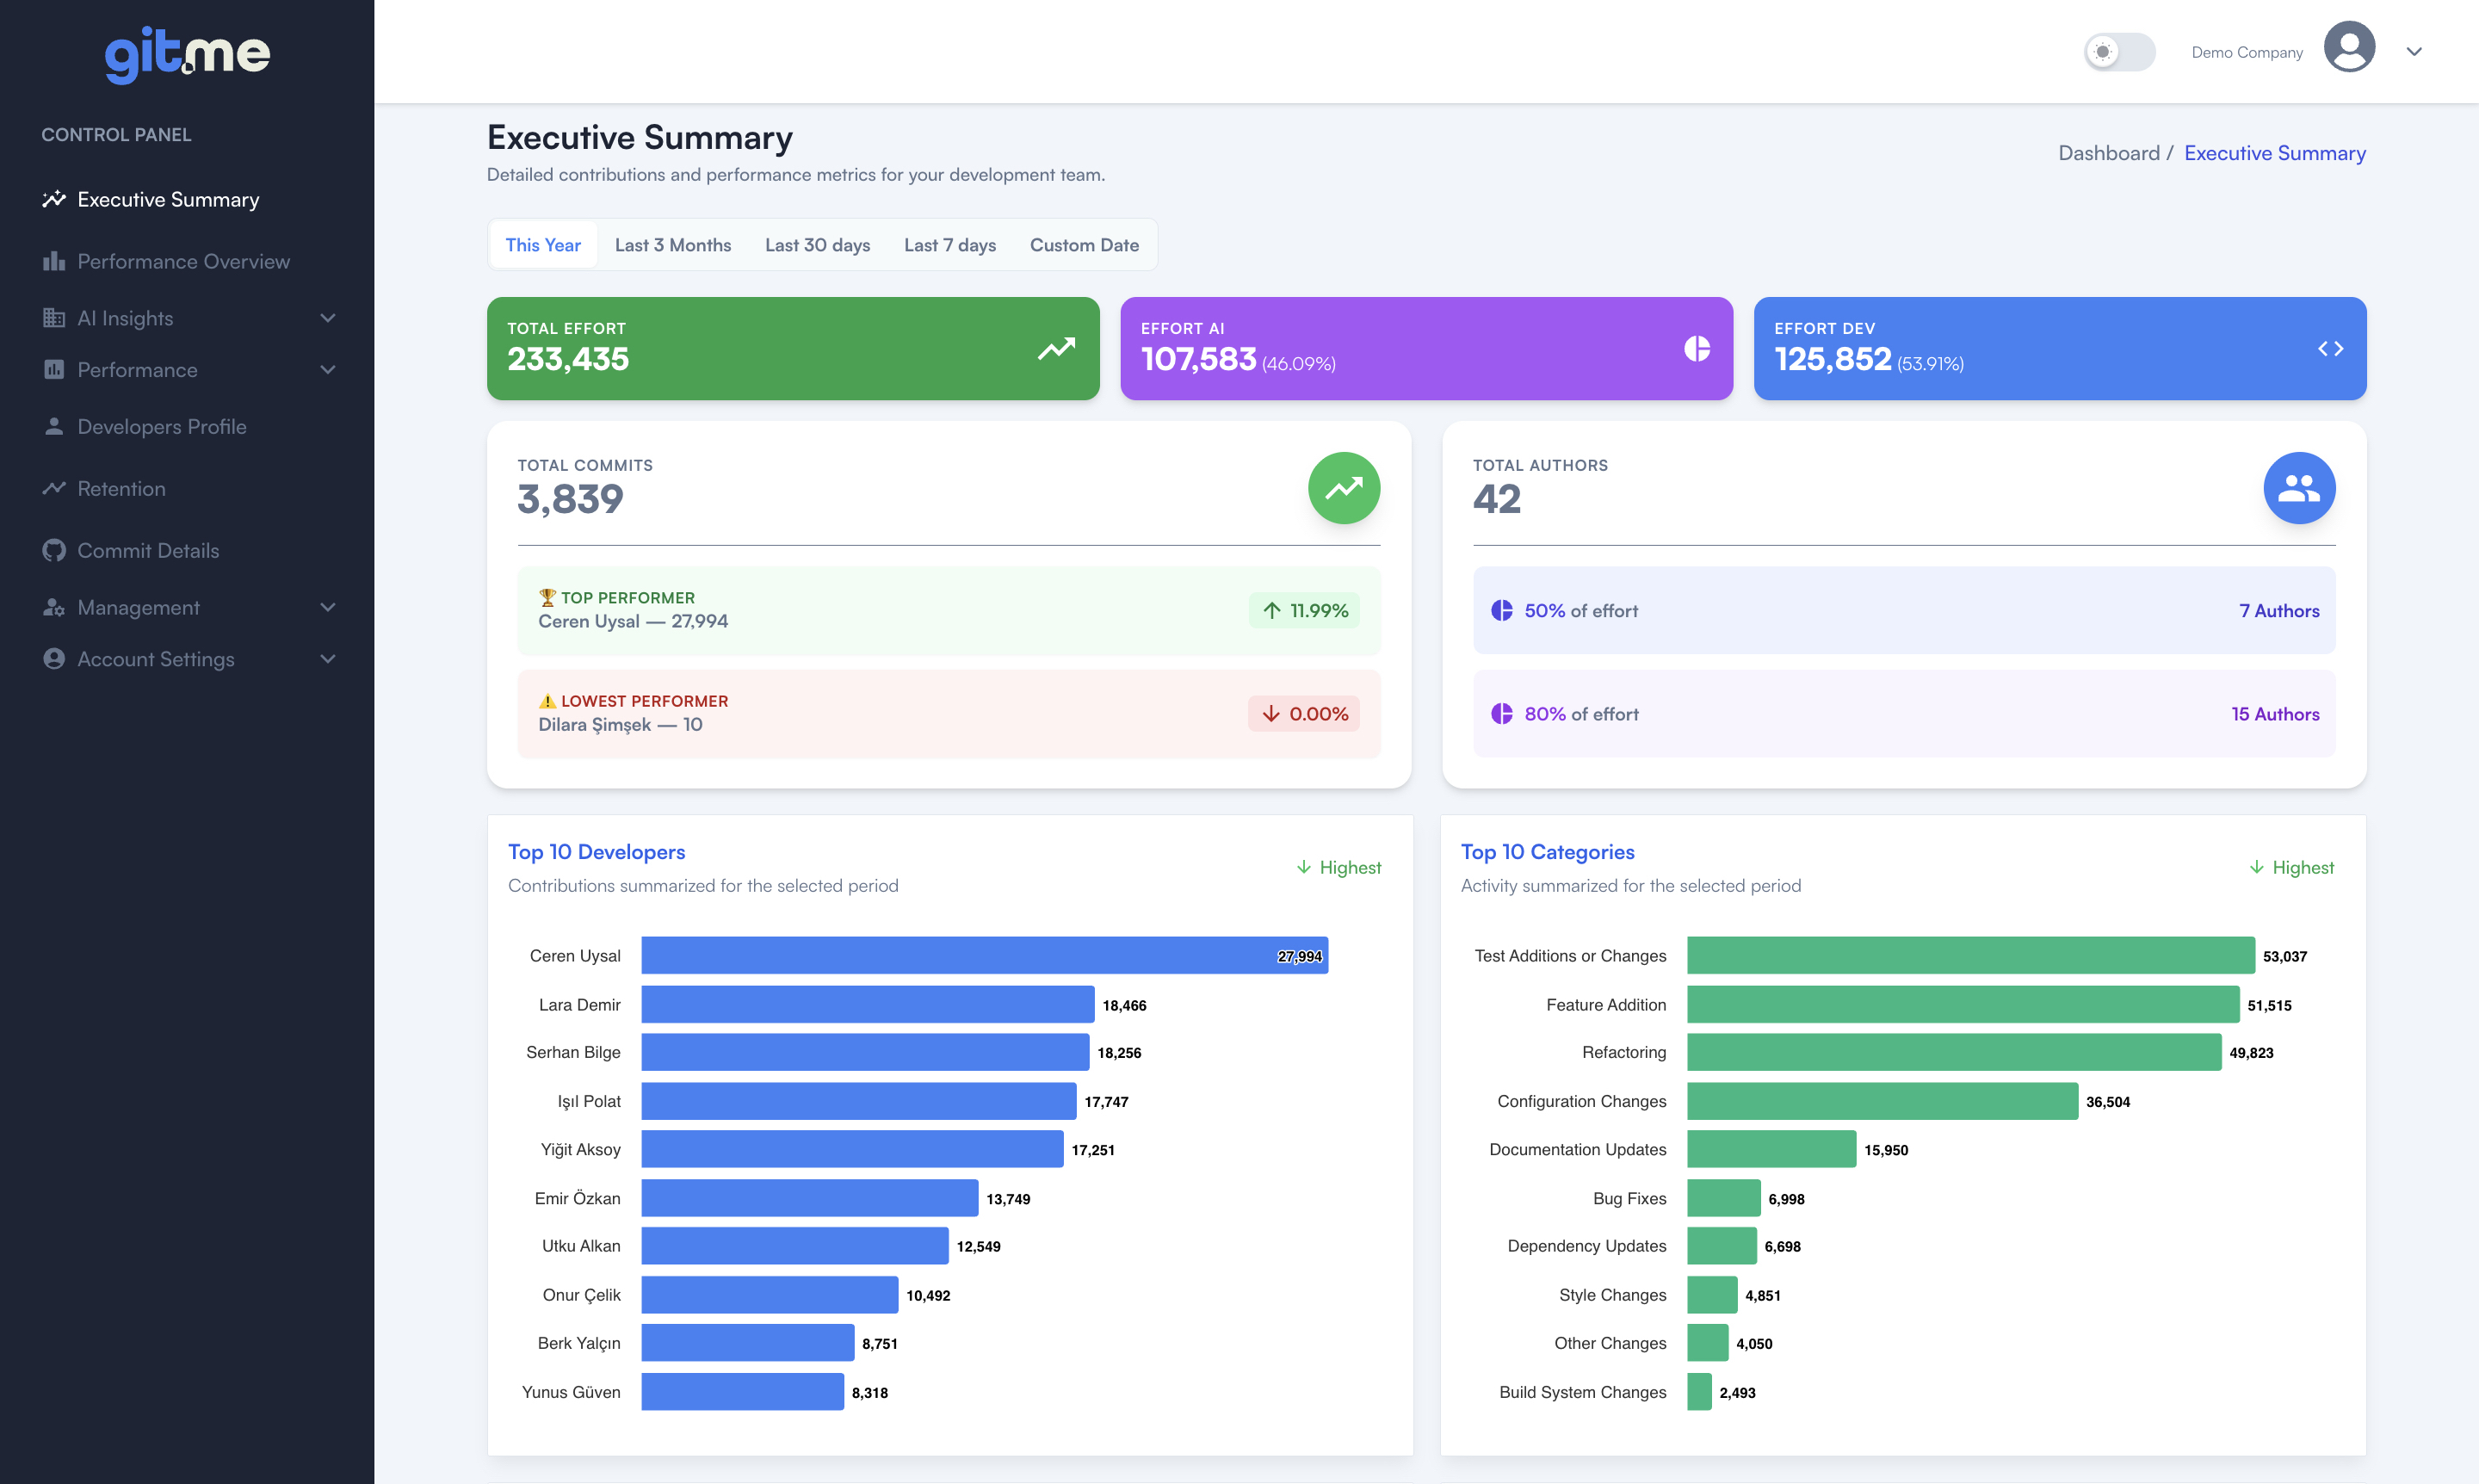
- Executive Summary:
Presents a high-level snapshot of your organization: total effort (split by AI vs. Developer), commit counts, active authors, and top/lowest performers. - Drill into breakdowns:
For developers, projects, repositories, and categories, supported by monthly contribution tiers that show activity intensity (Minimal → Extreme).
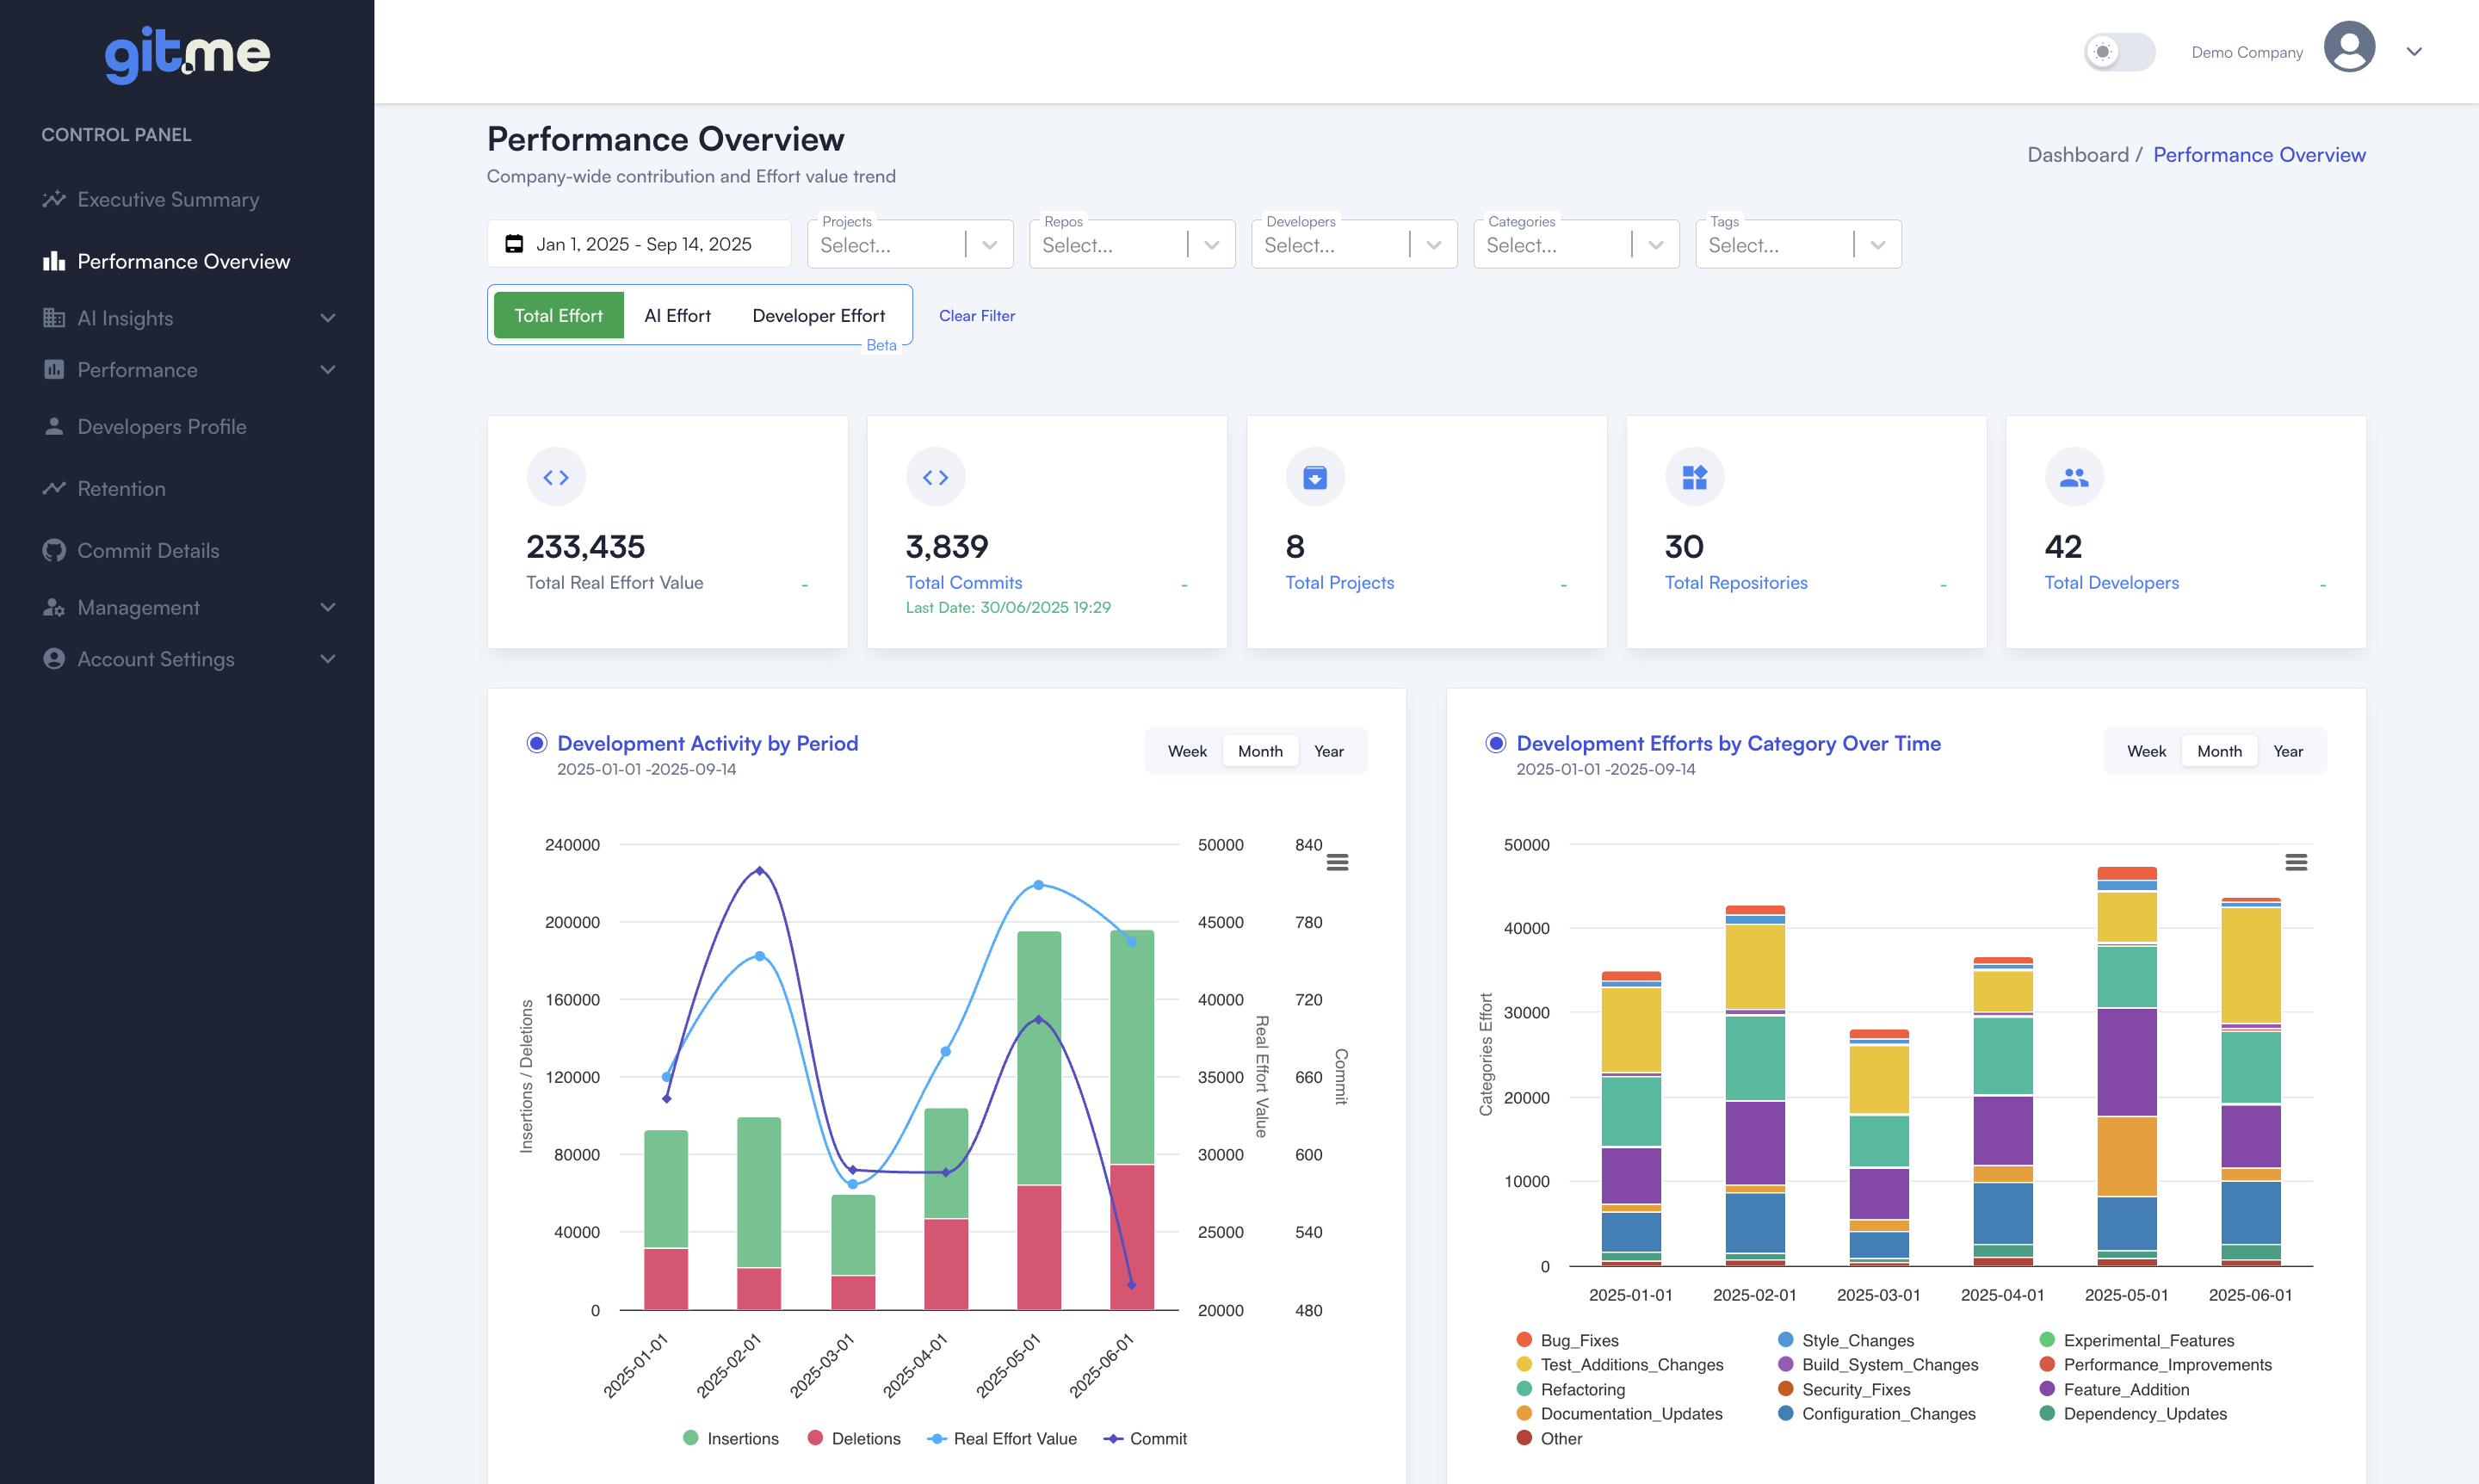
- Unified Overview Dashboard:
Get instant access to key metrics: total effort, commit count, project and repo health, and developer activity. Drill down by date range, project, repo, developer, category, or tag. - Contribution & Effort Trends:
Interactive charts show team and individual effort over time, revealing spikes, trends, and patterns in developer performance. - Real Effort Value Tracking:
Measure engineering effort beyond just commit count—see true workload and contribution using advanced effort metrics.
🤖 AI Insights
-
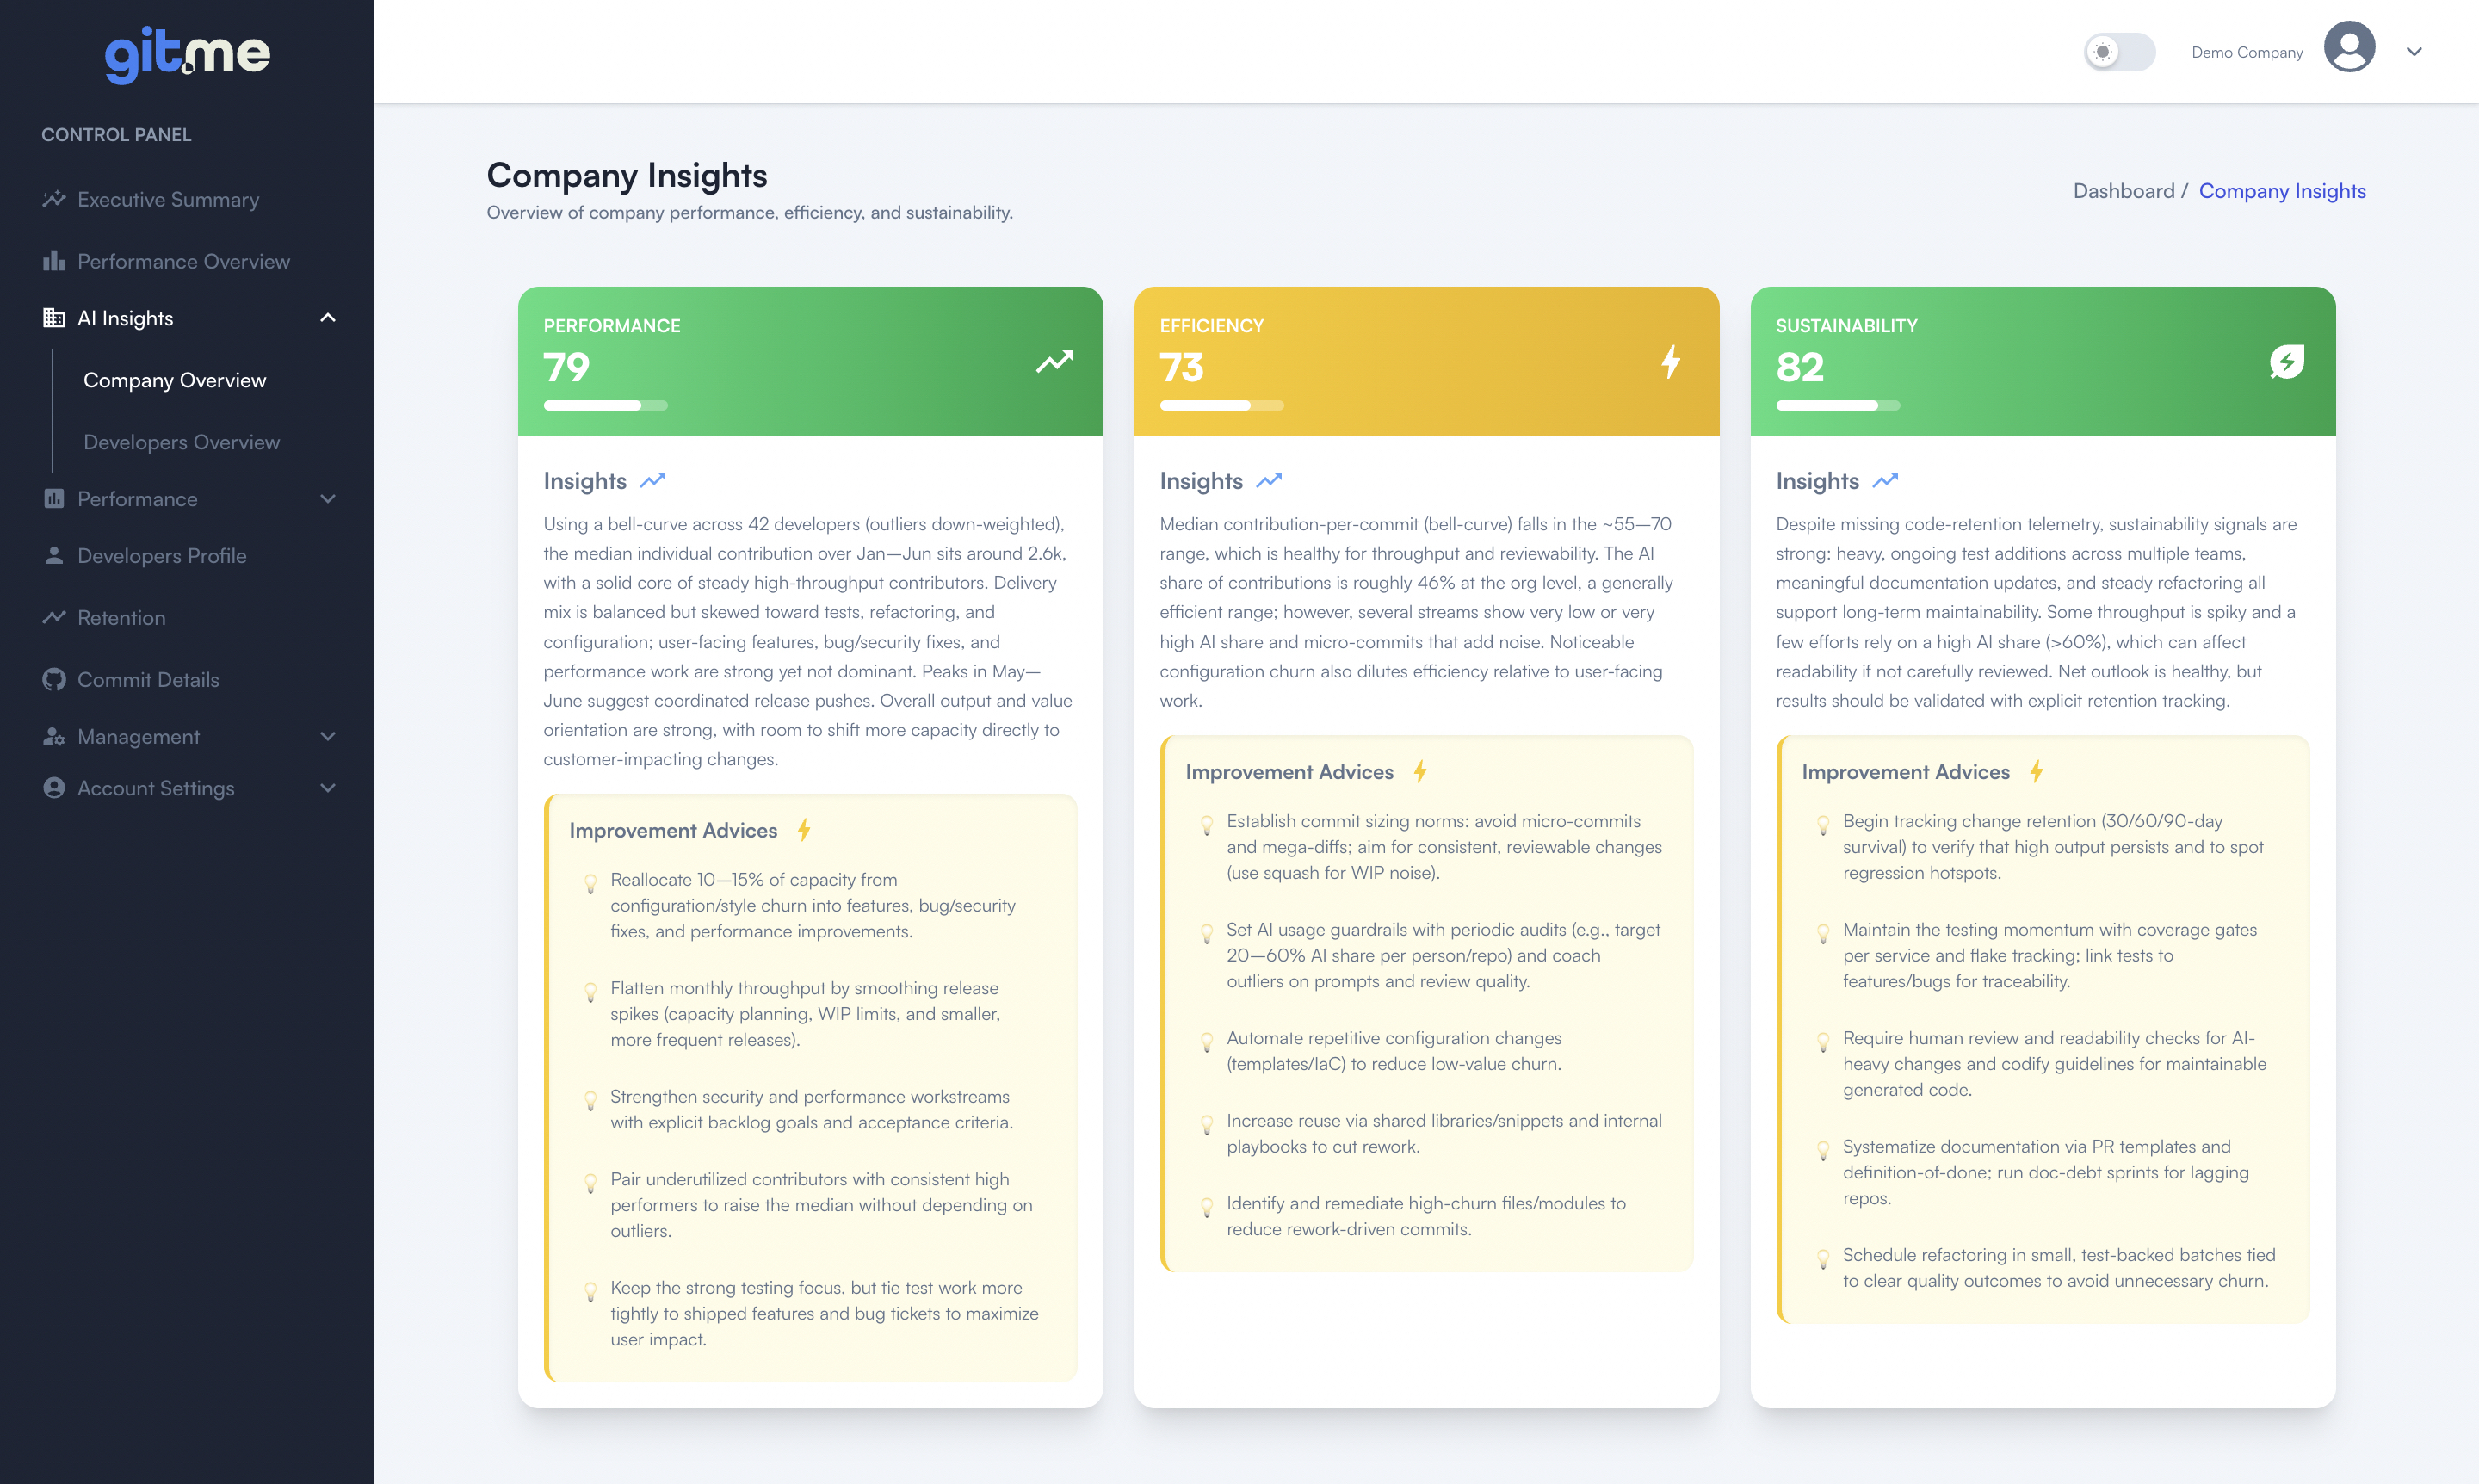
Company Insights:
Evaluate organization-wide contributions across three key dimensions—Performance, Efficiency, and Sustainability.
Get improvement advices to rebalance workload, increase test coverage, and boost long-term code retention. -
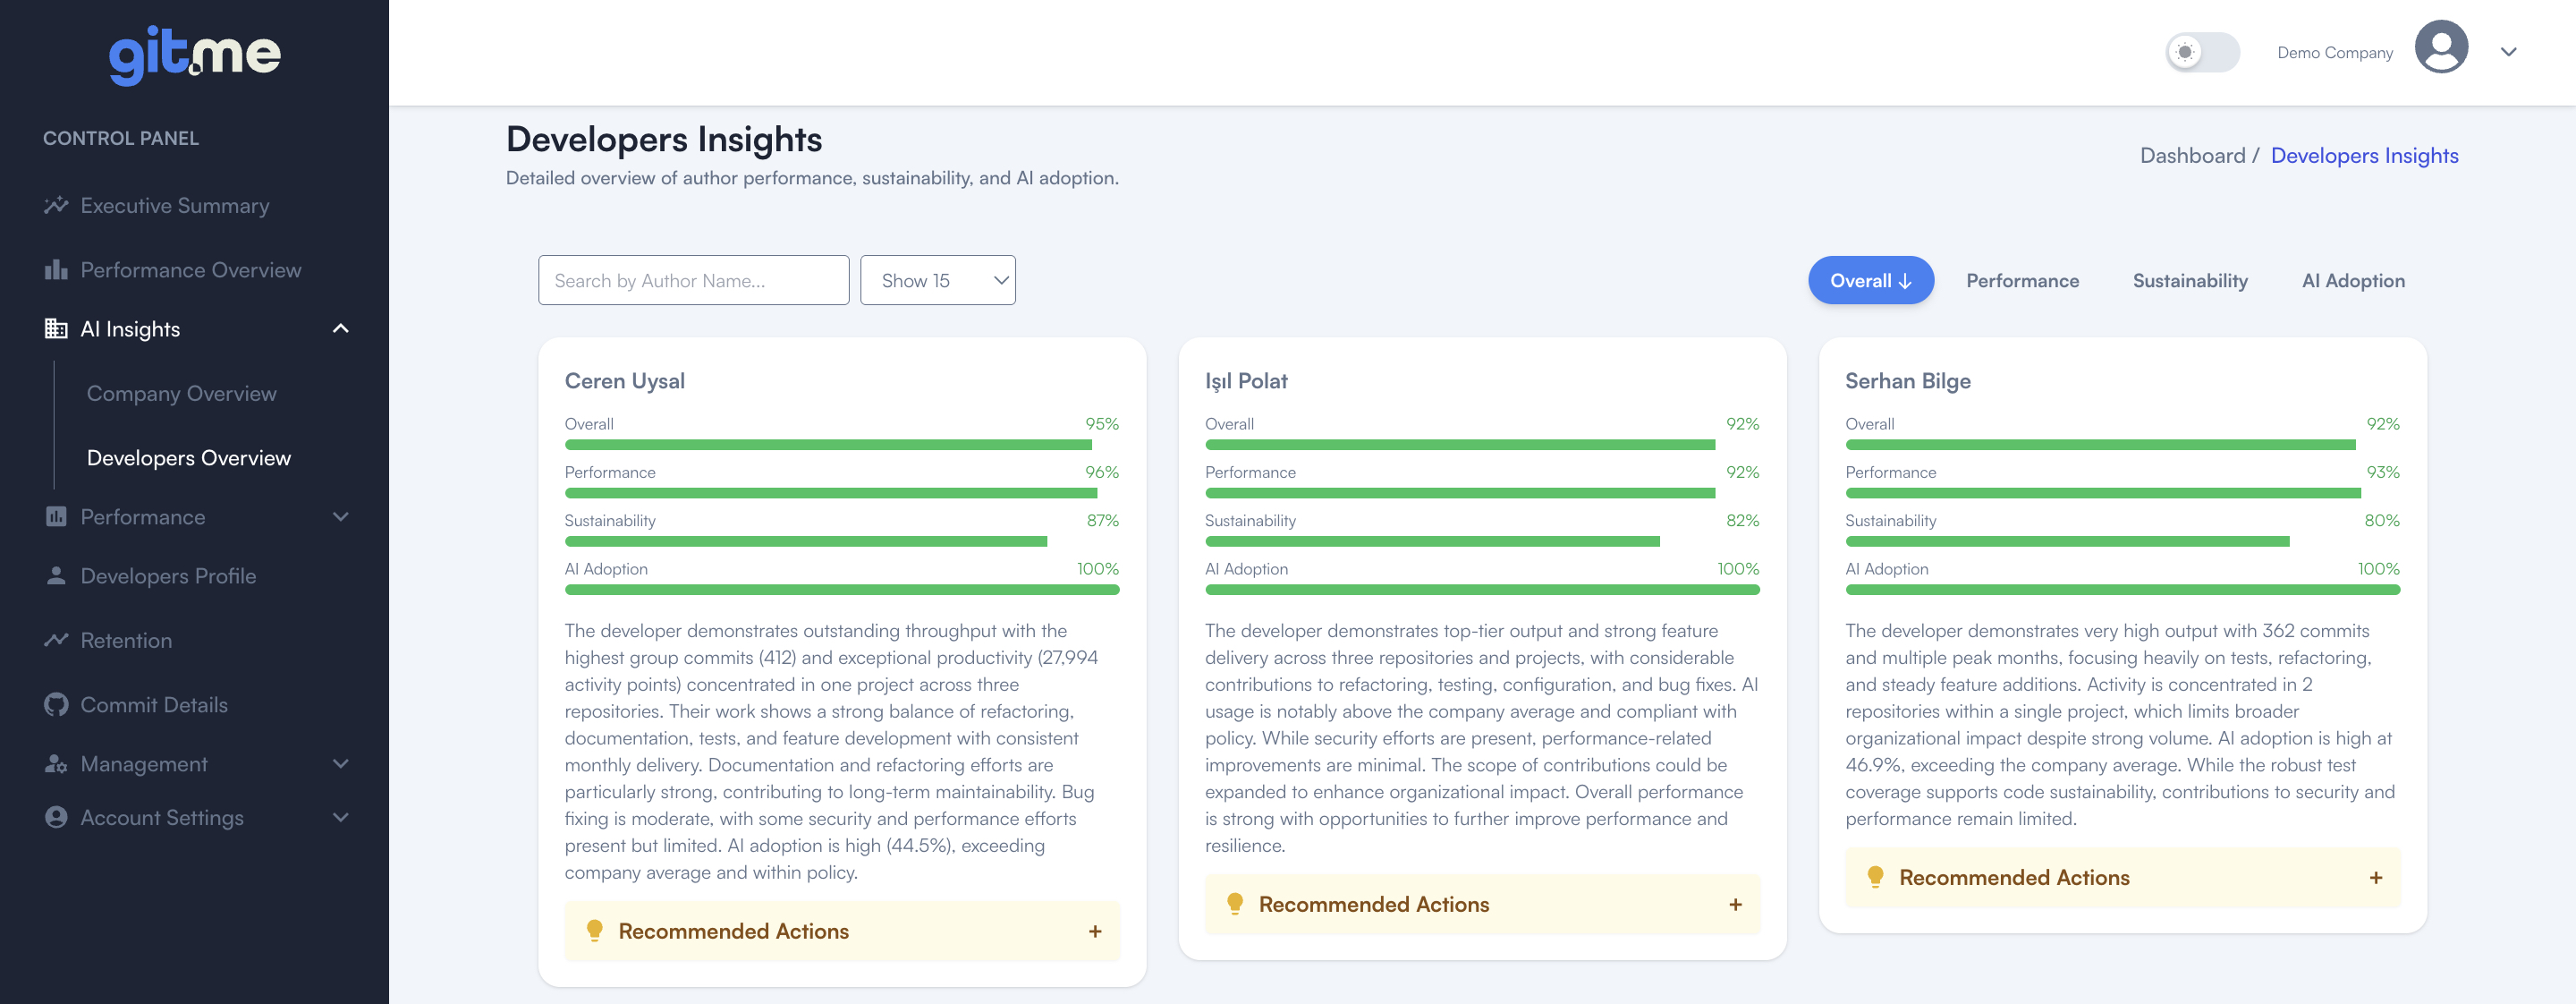
Developer Insights:
Individual scores for Performance, Sustainability, and AI Adoption.
Identify high performers, spot low-activity contributors, and receive tailored recommendations for growth. -
AI vs. Developer Effort:
Track and visualize how much of your engineering output is AI-assisted versus developer-driven, ensuring transparent adoption metrics.
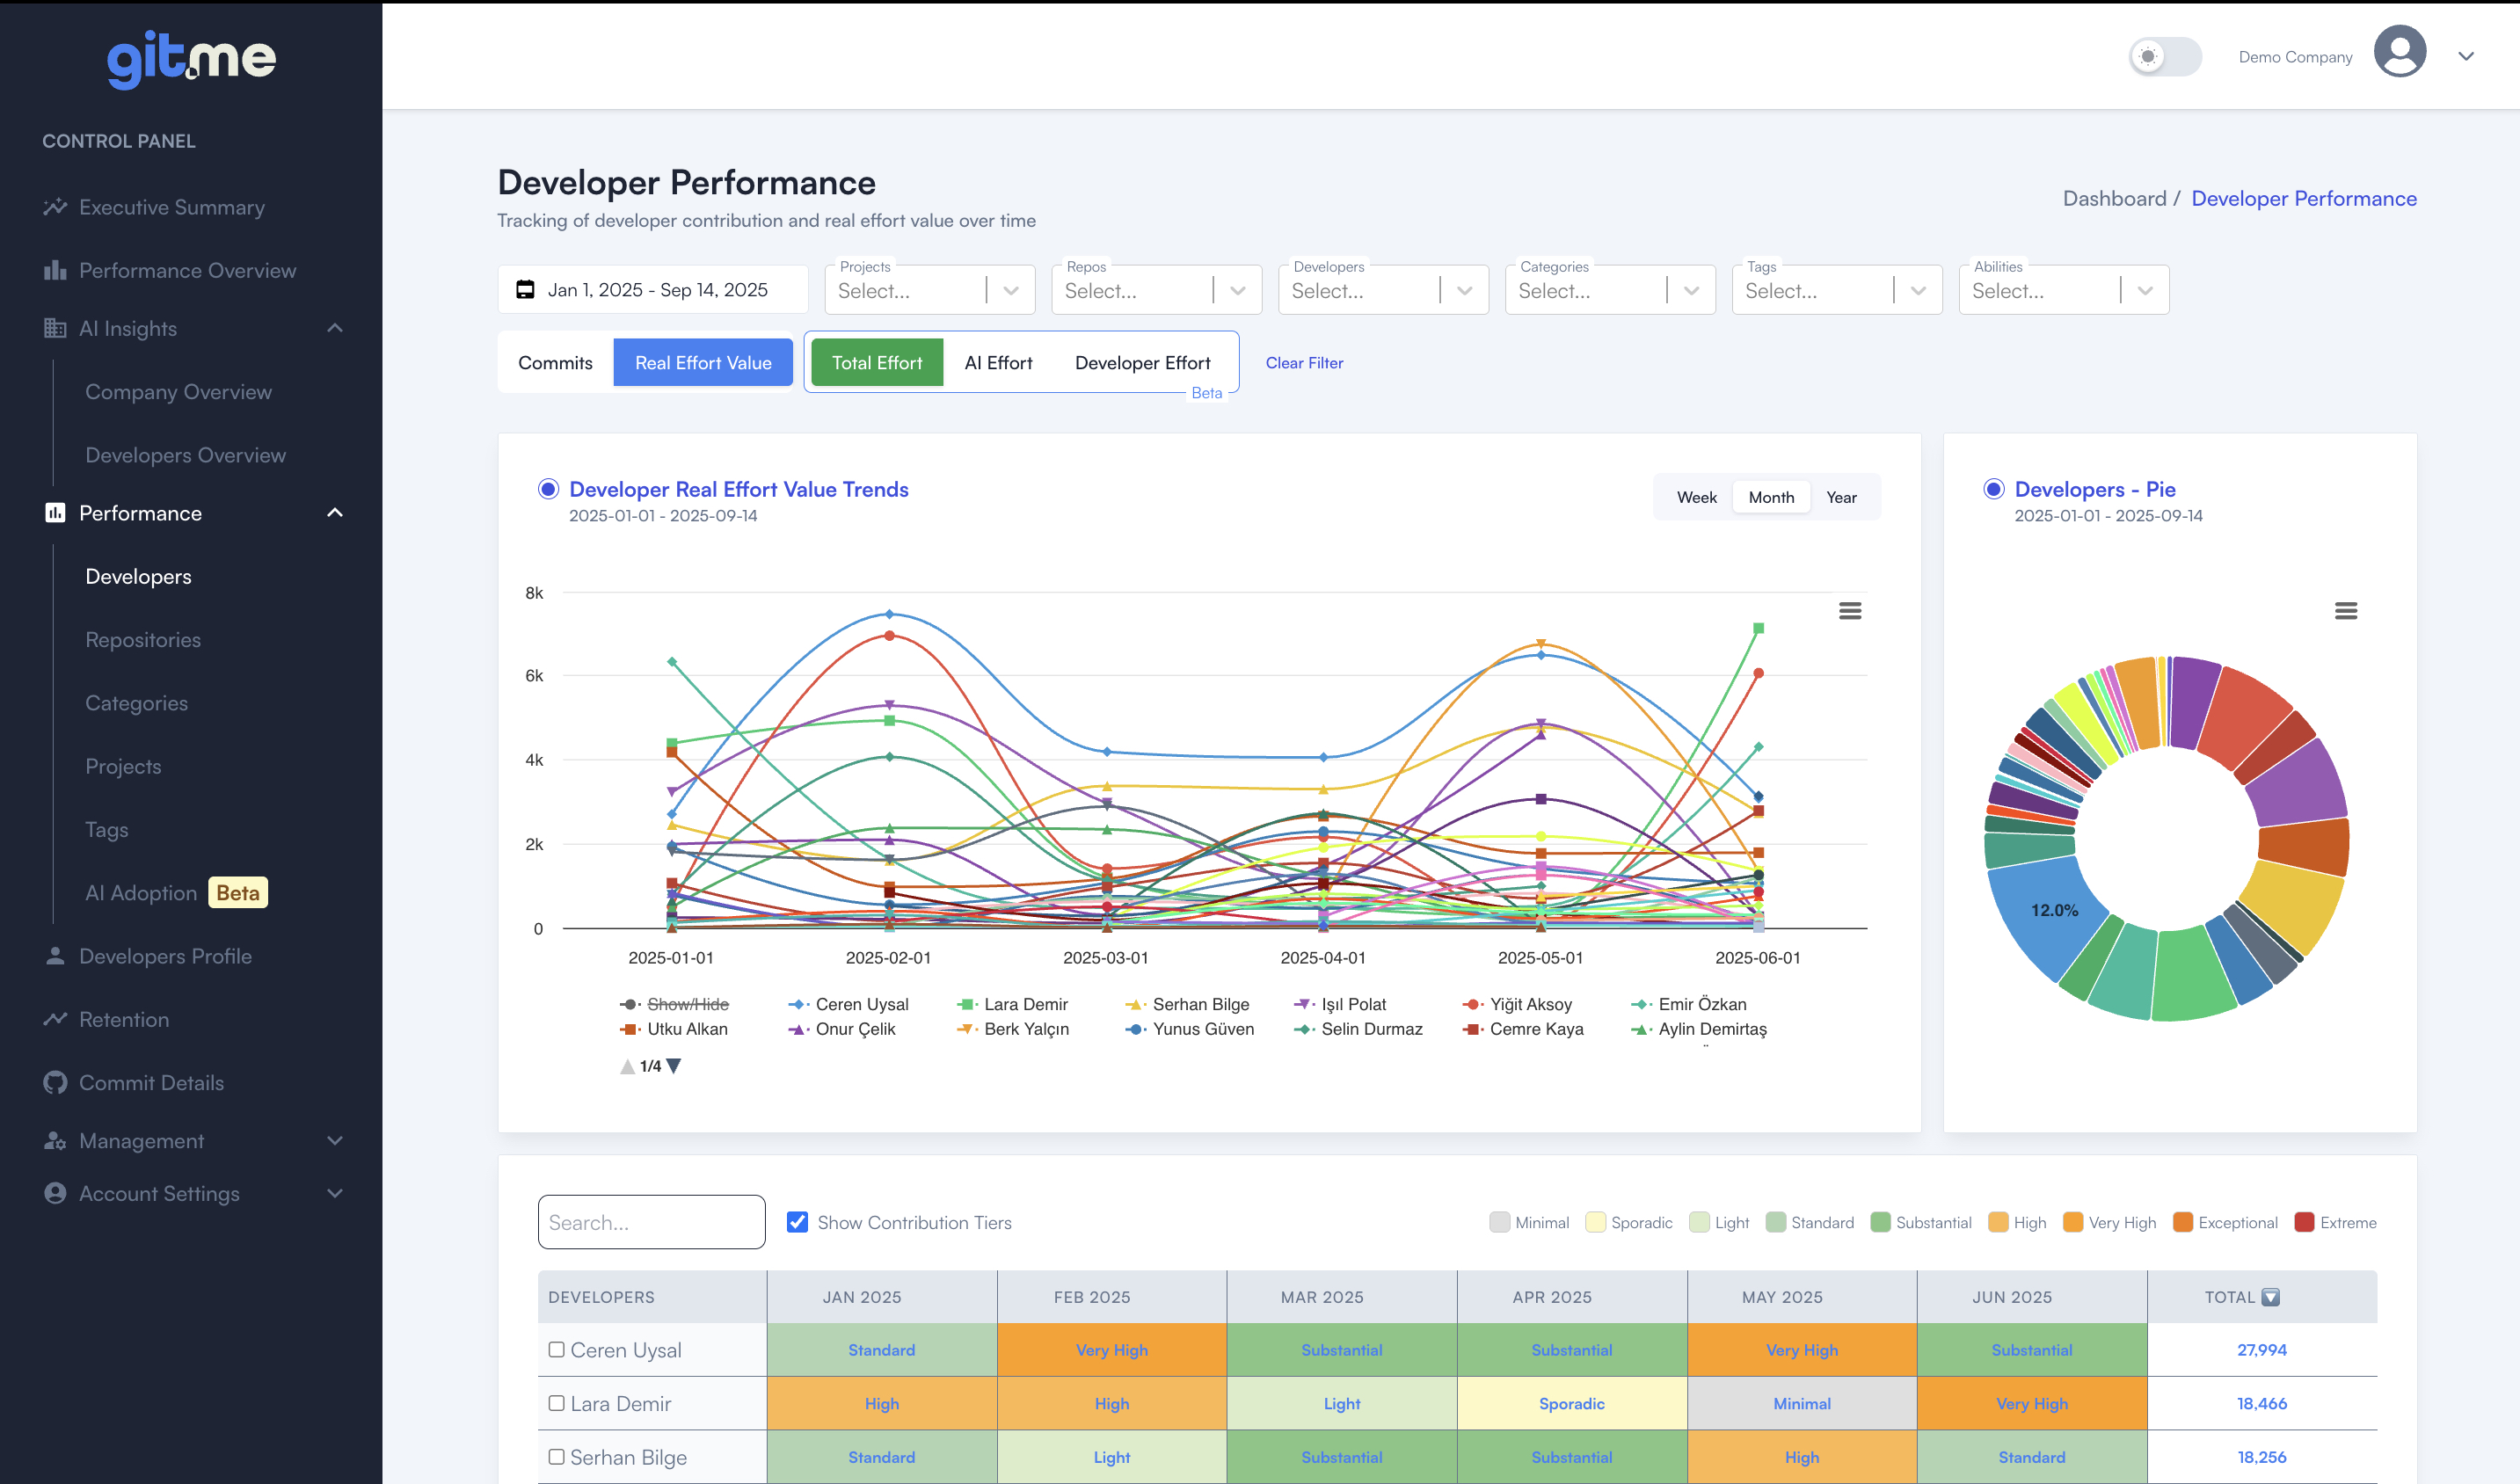
👥 Developer Performance and Contribution Tiers
- Developer Comparison:
Visualize individual developer effort trends and compare across your team with time-based line charts and donut (pie) distributions. - Contribution Tiers:
Instantly identify contribution intensity for each developer and time period (e.g., Minimal, Standard, High, Very High, Exceptional, Extreme), so you know who’s excelling, who needs support, and how work is distributed. - Dynamic Tables & Filters:
Search, filter, and analyze contribution data with interactive tables that highlight activity level and total impact.
🏷️ Flexible Tagging and Custom Grouping
- Smart Tag Management:
Organize developers and repos with custom tags for domain, stack, squads, or any custom grouping you need. - Easy Project Management:
Drag-and-drop interface for assigning repositories to projects, renaming, and restructuring as your organization evolves.
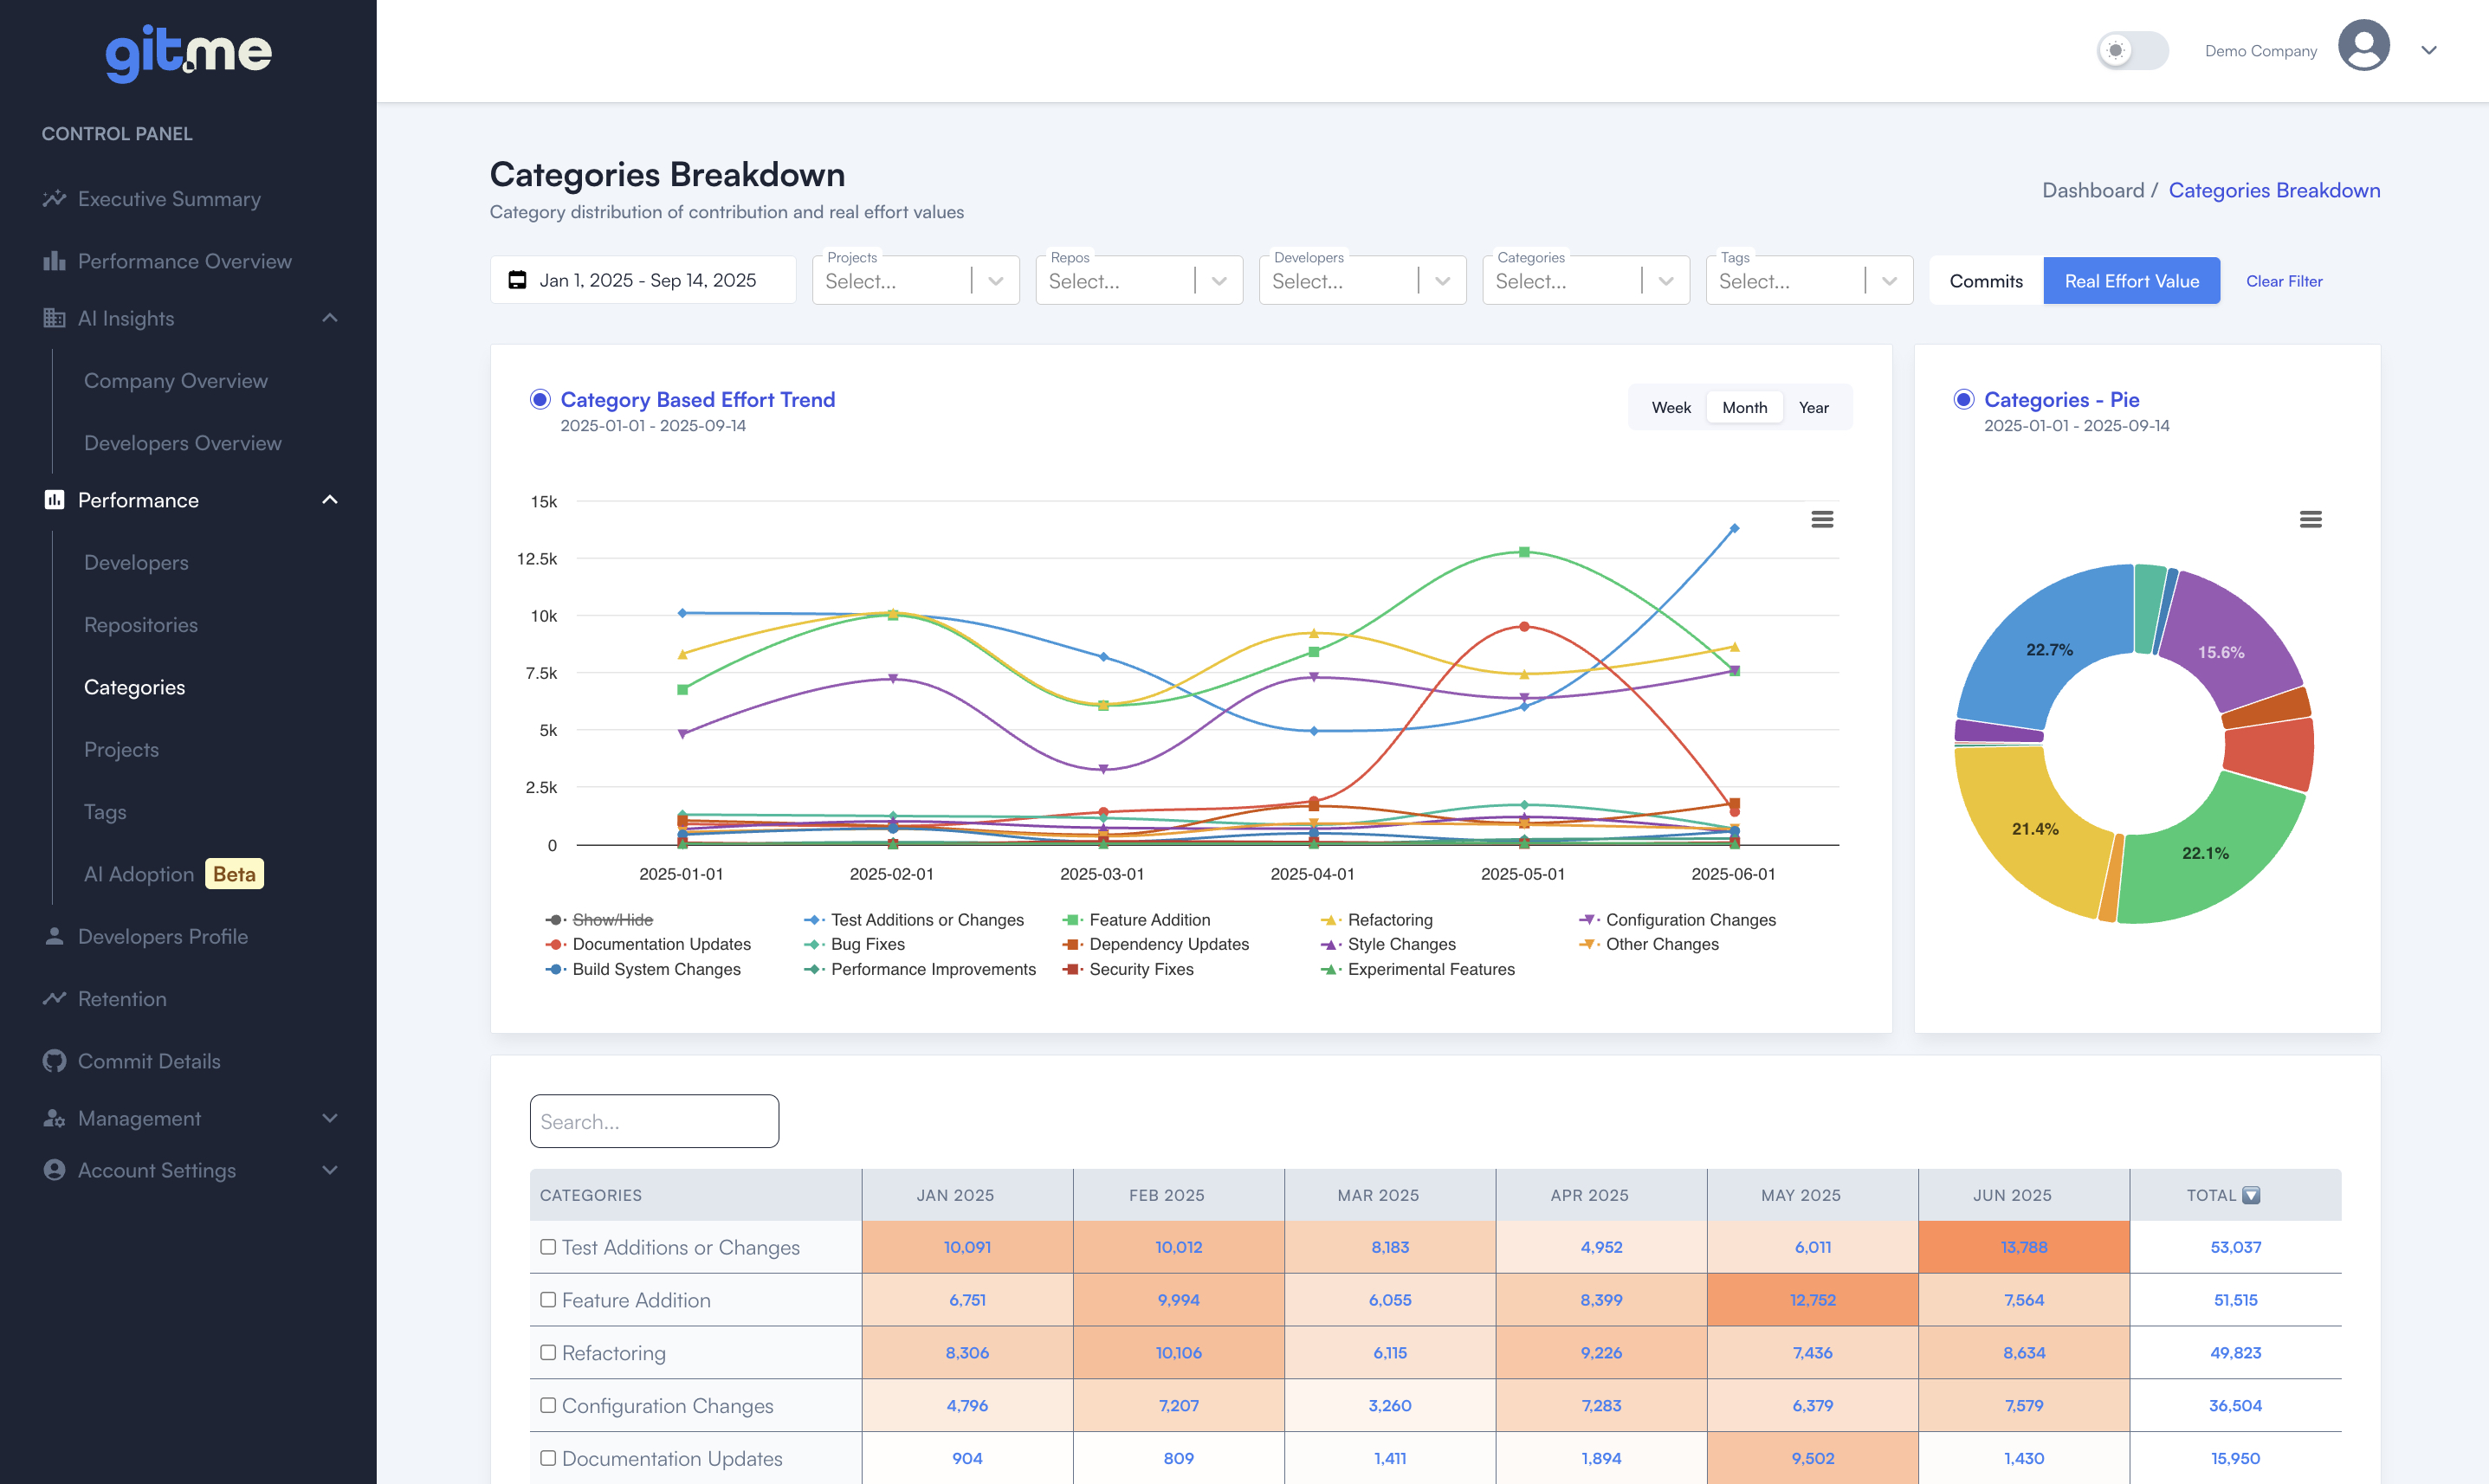
📈 Deep-Dive Reporting and Visualization
- Effort by Category:
Analyze where time is invested—bug fixes, features, refactoring, documentation, security, performance, and more. - Developer Profiles & Radar Charts:
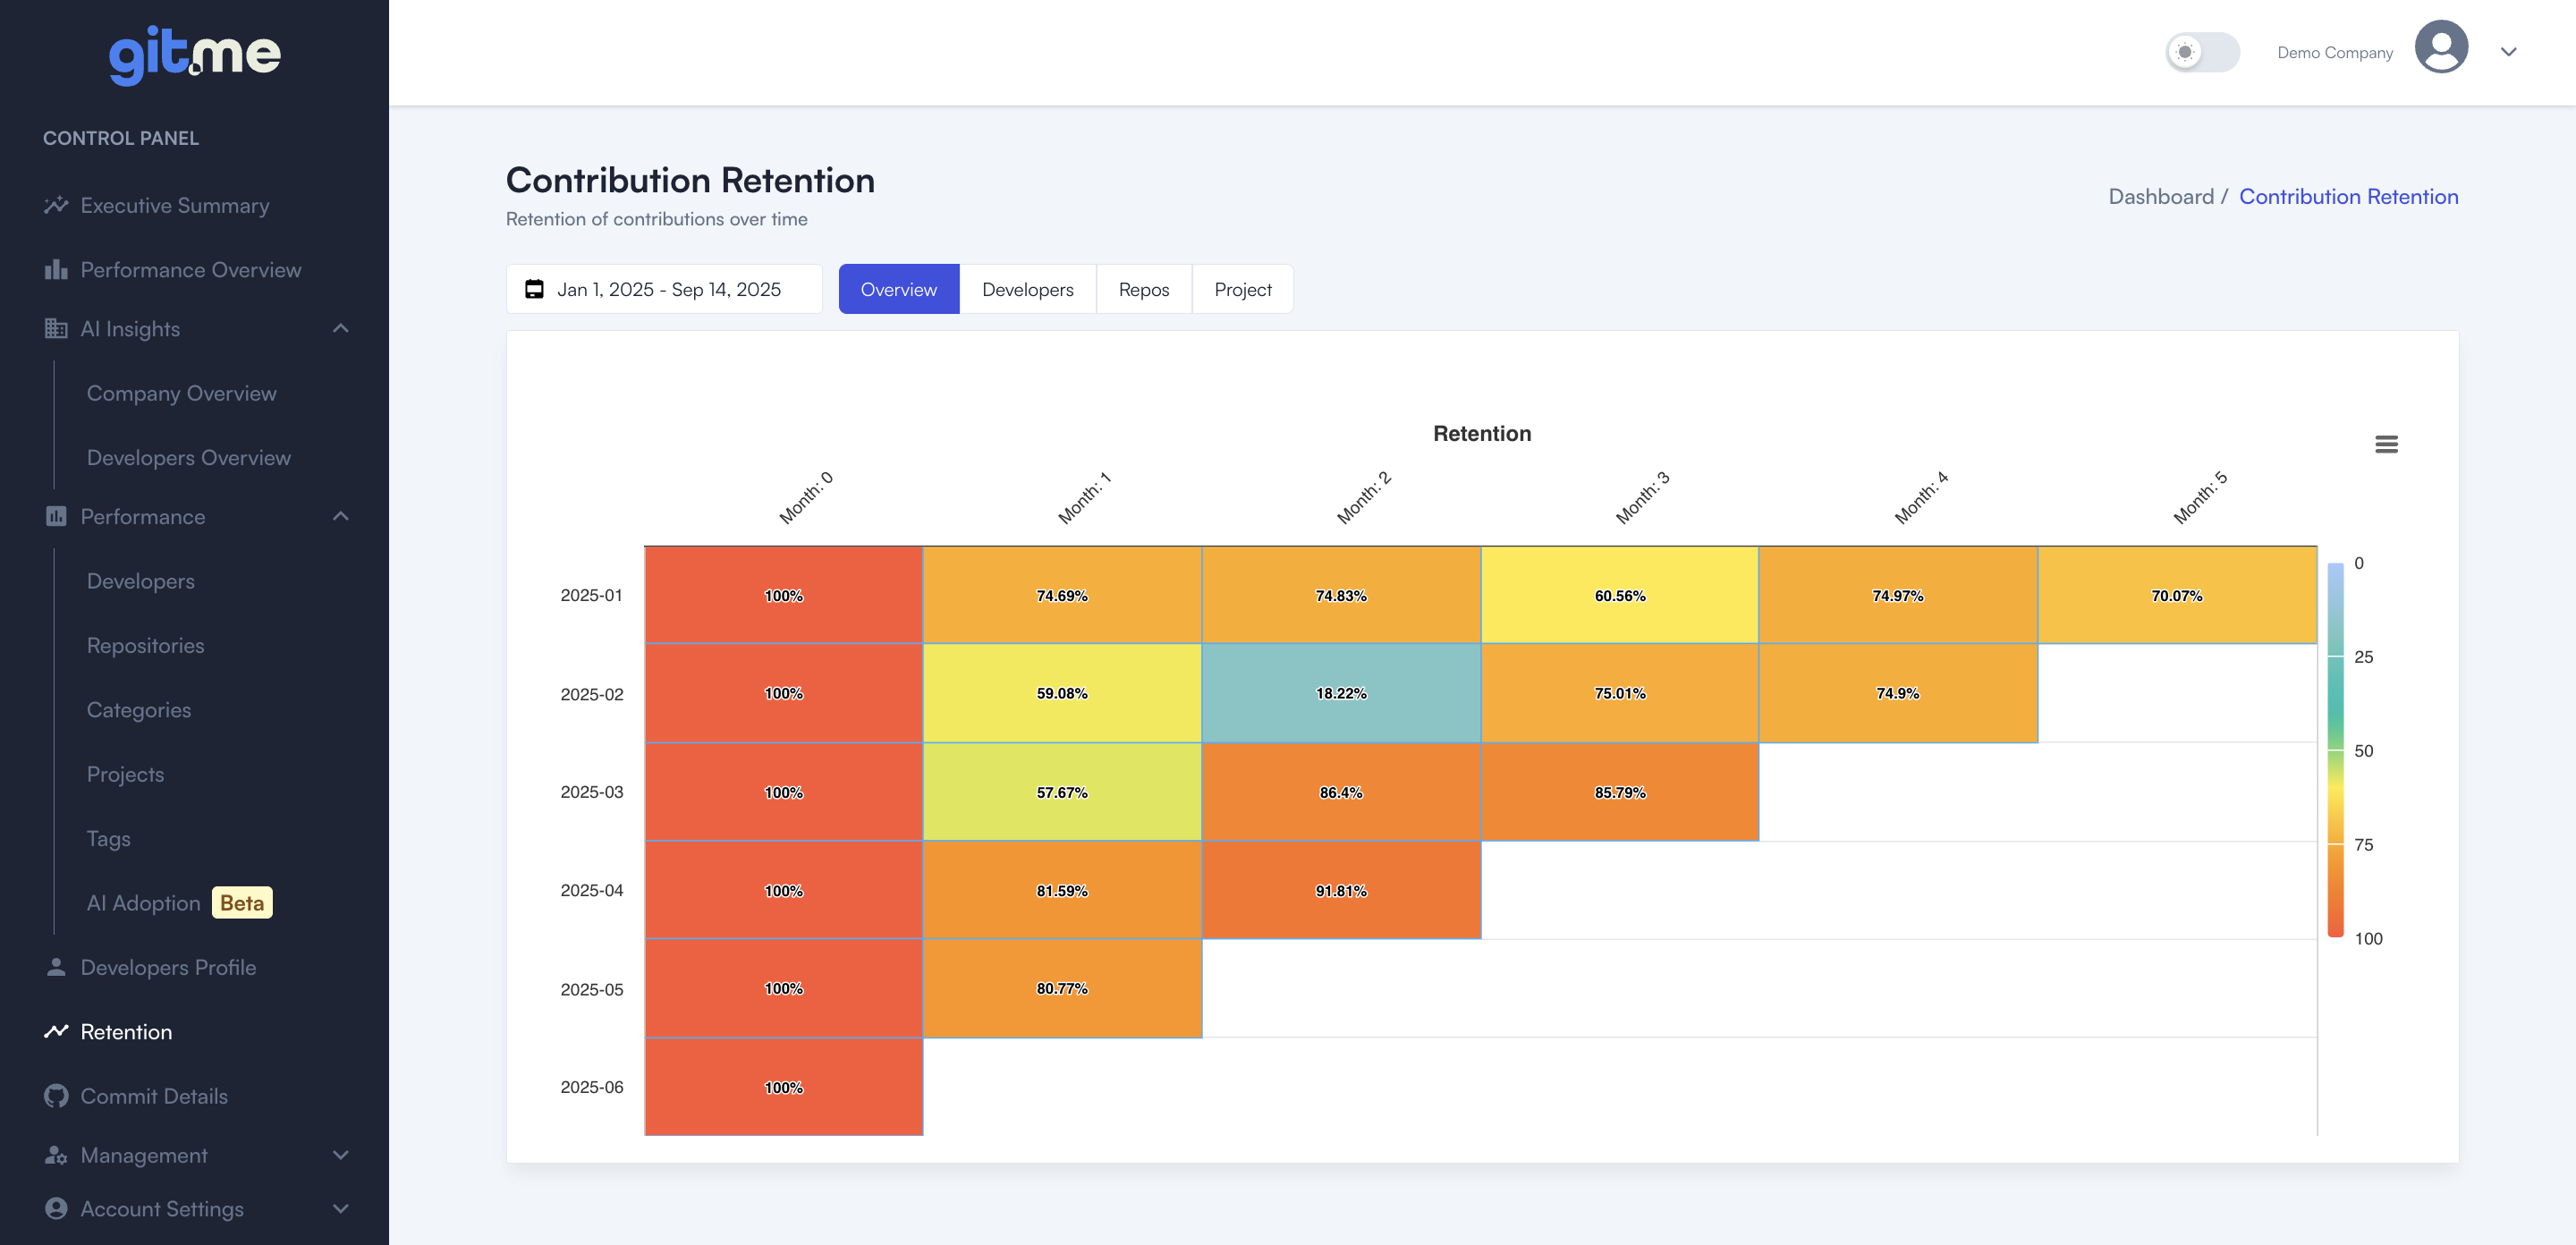
See each contributor’s strengths and focus areas visually—compare skillsets and effort distributions side by side. - Retention & Lifecycle Analytics:
Monitor how long code contributions remain relevant and impactful across projects or teams with visual heatmaps.
⚖️ Workload Balance, Collaboration and Health
- Spot Overload & Underload:
Instantly identify developers at risk of burnout or underutilization, enabling early intervention and healthier teams. - Collaboration Insights:
Reveal support networks: who helps the team, who relies on others, and how collaboration patterns evolve over time.
🌍 Segmented Analytics and Transparency
-
In-House vs. Outsource:
Compare contribution and performance across in-house and outsourced talent for strategic workforce decisions. -
Tag Management:
Tag your developers with any organizational dimension—such as teams, roles, seniority, or areas of expertise—for flexible grouping and powerful analytics.
For example:- Teams: Frontend, Backend, DevOps
- Seniority: Junior, Senior, Lead
- Expertise: React, Node.js, Data Science
This enables you to filter, compare, and analyze developer performance, balance workloads across any group, and easily identify capacity gaps or future hiring needs within your organization.